Page 23 of 228 FirstFirst ... 1321222324253373123 ... LastLast
Results 221 to 230 of 2276

Thread: OT: Politics

  1. #221
    Insider
    Join Date
    Apr 2012
    Location
    Knoxville, TN
    Posts
    2,303
    Does the graph I posted say anything about temperature?
    No need to be obtuse - you asked why they had different rates. I explained. Showing where the warming is suppose to be (300mb) required the picture of one, so you could understand the reason that humidity level is used from the lower graph.

    the graph distinctly shows no increase in solar output over the area in question.
    Its the Yellow part Gordon. Really.

    Between both of you for being obtuse, Gordon is still winning. Better step up your game Steve.

    https://www.researchgate.net/publica...ast_Millennium

    The main aim of this research was to disentangle temperature vari-ability and its impact on the functioning of a pristine lake in SE Norwaywith emphasis on climatic events related to changes in solar radiationand the NAO. The sediment core from Lake Atnsjøen located in thearea with relatively low anthropogenic activity was analyzed. The re-construction of climate changes and their impact on the lake environ-ment during the last Millennium was performed using paleoecologicaland geochemical methods at ~30 yr resolution from a sediment core

    Climate variability and lake ecosystem responses in western Scandinavia (Norway) during the last Millennium (PDF Download Available). Available from: https://www.researchgate.net/publica...ast_Millennium [accessed Nov 17 2017].
    Last edited by pbjosh; 11-17-2017 at 05:20 PM.
    Josh Coray
    J4 Paintball
    Lead Design
    www.j4paintball.com

  2. #222
    Insider
    Join Date
    Apr 2012
    Location
    Knoxville, TN
    Posts
    2,303
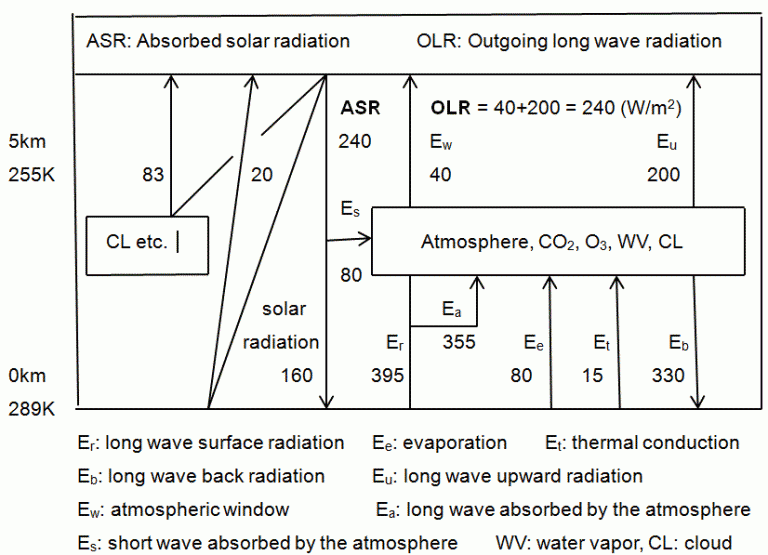
    And hey, Max Plank Institute:

    https://www.mpg.de/research/sun-activity-high

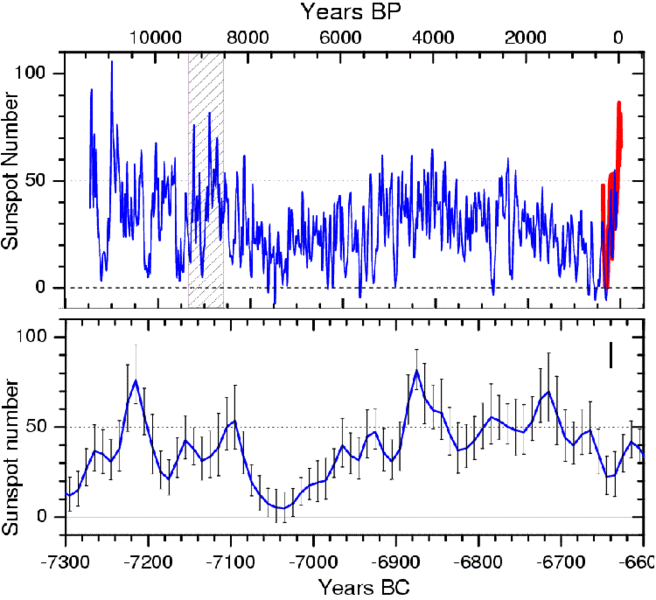
    For many studies concerning the origin of solar activity and its potential effect on long-term variations of Earth's climate, the interval of time since the year 1610, for which systematic records of sunspots exist, is much too short. For earlier times the level of solar activity must be derived from other data. Such information is stored on Earth in the form of "cosmogenic" isotopes. These are radioactive nuclei resulting from collisions of energetic cosmic ray particles with air molecules in the upper atmosphere. One of these isotopes is C-14, radioactive carbon with a half life of 5730 years, which is well known from the C-14 method to determine the age of wooden objects. The amount of C-14 produced depends strongly on the number of cosmic ray particles that reach the atmosphere. This number, in turn, varies with the level of solar activity: during times of high activity, the solar magnetic field provides an effective shield against these energetic particles, while the intensity of the cosmic rays increases when the activity is low. Therefore, higher solar activity leads to a lower production rate of C-14, and vice versa.

    By mixing processes in the atmosphere, the C-14 produced by cosmic rays reaches the biosphere and part of it is incorporated in the biomass of trees. Some tree trunks can be recovered from below the ground thousands of years after their death and the content of C-14 stored in their tree rings can be measured. The year in which the C-14 had been incorporated is determined by comparing different trees with overlapping life spans. In this way, one can measure the production rate of C-14 backward in time over 11,400 years, right to the end of the last ice age. The research group have used these data to calculate the variation of the number of sunspots over these 11,400 years. The number of sunspots is a good measure also for the strength of the various other phenomena of solar activity.

    The method of reconstructing solar activity in the past, which describes each link in the complex chain connecting the isotope abundances with the sunspot number with consistent quantitative physical models, has been tested and gauged by comparing the historical record of directly measured sunspot numbers with earlier shorter reconstructions on the basis of the cosmogenic isotope Be-10 in the polar ice shields. The models concern the production of the isotopes by cosmic rays, the modulation of the cosmic ray flux by the interplanetary magnetic field (the open solar magnetic flux), as well as the relation between the large-scale solar magnetic field and the sunspot number. In this way, for the first time a quantitatively reliable reconstruction of the sunspot number for the whole time since the end of the last ice age could be obtained.

    Because the brightness of the Sun varies slightly with solar activity, the new reconstruction indicates also that the Sun shines somewhat brighter today than in the 8,000 years before. Whether this effect could have provided a significant contribution to the global warming of the Earth during the last century is an open question. The researchers around Sami K. Solanki stress the fact that solar activity has remained on a roughly constant (high) level since about 1980 - apart from the variations due to the 11-year cycle - while the global temperature has experienced a strong further increase during that time. On the other hand, the rather similar trends of solar activity and terrestrial temperature during the last centuries (with the notable exception of the last 20 years) indicates that the relation between the Sun and climate remains a challenge for further research.
    Josh Coray
    J4 Paintball
    Lead Design
    www.j4paintball.com

  3. #223
    Insider
    Join Date
    Apr 2012
    Location
    Knoxville, TN
    Posts
    2,303
    And yes, the counter reply is this, to save Steve time (but not Gordon):

    https://arxiv.org/ftp/arxiv/papers/1601/1601.05397.pdf

    We estimate the effects of the new
    SILSO record on two widely used TSI reconstructions, namely the NRLTSI2 and the SATIRE models. We find that
    the SILSO record has little effect on either model after 1885 but leads to greater amplitude solar-cycle fluctuations
    in TSI reconstructions prior, suggesting many 18th and 19th century cycles could be similar in amplitude to those of
    the current Modern Maximum. TSI records based on the revised sunspot data do not suggest a significant change in
    Maunder Minimum TSI values, and comparing that era to the present we find only very small potential differences
    in estimated solar contributions to climate with this new sunspot record.


    The average is just that. Average. No real movement. Recently.

    BUT, there is a 3wm^2 cycle in that time. And over time, there is a 6wm^2 increase.

    The CO2 signal is only about .25wm^2 since 1950. It is lost in the noise man. If that .25wm^2 mattered so much, why haven't we see dramatic changes every solar cycle?
    Josh Coray
    J4 Paintball
    Lead Design
    www.j4paintball.com

  4. #224
    Insider PBSteve's Avatar
    Join Date
    May 2012
    Location
    Los Angeles
    Posts
    3,084
    I wasn't being obtuse I was trying to get you to catch your own error since I can't tell you without being swamped by a wall of tangentially related quotes.

    You're posting quantity without forming full connections between concepts and arguments. It's not persuasive.

    If you want to convince me of anything about solar impact, you'll have to start by showing me you understand how the energy accounting works. You're still making errors. It makes next to no sense to compare TSI to CO2 forcing.

    A great start would be making this post less "opinion".

    Quote Originally Posted by pbjosh View Post
    Let's take a step back here, I just want to make a quick comment of relativity. This might help put things in perspective.

    Per the models, after the paper Mann signed, we are left with the potential of 1.1wm^2 of increased warming for a doubling of CO2 from the 1850's.

    That is from 275ppm, to 550ppm. Let's assume that is fine.

    At 400ppm, we are looking at 25% of that 1.1wm^2 - so, about .25wm^2. If the forcing was in play, that would be about .75wm^2, total input from 1850.


    This fluctuates a bit here and there, SOON et al 2015 shows a very robust suggestion of up to 5wm^2 change (and the paper is open source, so http://citeseerx.ist.psu.edu/viewdoc...=rep1&type=pdf

    That is 1357wm^2 to about 1365wm^2, or maybe less.

    Now, looking at the basic equation, what is there as a potential for a small change .5wm^2 or even 1.5wm^2 - so we can say the AGW element w/o forcing would be 33% of the total warming, or up to 60% of the warming if the forcing was part of it.

    On the high side for TSI variation, at 5 or 6 wm^2 then you are looking at only being about 5% to 15% for the AGW element with or without forcing.

    If we get to 550ppm, if we use the low TSI variable: then we are adding 1wm^2 to .5wm^2 output, a significant amount. If the forcing was in effect - that is a huge deal!

    Where as, if we are adding 1.1wm^2 to 5wm^2, then we still are dealing with nearly 20% of the effect being from human production. Which is still significant, but one is scary and the other is dealable.

    So I hardly think ignoring the CO2 output is stupid - we just have to see and study the TSI and related data far better so we can get a grasp on the true baselines.

    As much as people are saying I am anti-science, the truth is I think the science is still rather poor. The US Government has spent billions on Climate - But very little on actually advancing the science. The IPCC is focused on what could be the damage of AGW. The US Gov has spend a lot of solar panels, carbon capture, batteries, and various related project, to the tune of over $80B.

    But the dataset GHCN is fairly weak, the Surface Stations are fairly poorly sited, and we still have some big unknowns.

    First we need to figure out a lot of variables. A LOT. We need models that track reality. We need a comprehensive surface station database. We need at least a second satellite.

    I am very science on this. Lets science the shit out of this.
    Ever so many citizens of this republic think they ought to believe that the Universe is a monarchy, and therefore they are always at odds with the republic. -Alan Watts

    I work for the company building the Paragon

  5. #225
    Insider
    Join Date
    Apr 2012
    Location
    Knoxville, TN
    Posts
    2,303
    Sorry, I have been busy lately.

    A large number of the full posts have been verbose to blunt the Gordon bit about there not being a change in solar output.

    Your comments have been obtuse though. Take this for example:

    If you want to convince me of anything about solar impact, you'll have to start by showing me you understand how the energy accounting works. You're still making errors. It makes next to no sense to compare TSI to CO2 forcing.
    I understand - though I might not be able to explain it well. Often I am making broad statements so as to relay a concept and relative energy, vs trying to work on a very complicated equation. You on the other hand seem to miss large factors of the equation, and the elements in play. Also trying to be exact when the science still holds many unknowns, or some disputable factors is premature. So I am making broad, inelegant comments to convey that uncertainty, and I am picking scattershot points within the margin of error for easy graspable math. There are peer reviewed papers all over the place that show everything from no variation in solar output to huge variations, and peer reviewed papers and models that show positive feedbacks over 3X, while empirical data and peer reviewed papers shows a negative feedback of .5 - That is not a settled science, and shows huge variations. Even then, there most likely is a problem in how I am presenting it in a manner you can acknowledge it. The hard and fast numbers are just in the models. Real life is quite messy yet. The 3x forcing was a 'hard' number - until it wasn't any more.

    You say it makes no sense to compare TSI to CO2 forcing. But I am not comparing, so much as accounting for all of the pieces of the puzzle. It is fairly simple, but I do fill in the blanks in my head, which means I leave those out in discussion.

    This is a basic black body equation, with a modifier for the atmosphere. You have solar output to the object at a higher level radiation input, followed by absorption, and remittance at a lower bandwidth. This lower bandwidth is further complicated by the troposphere (the modifier) that will have added absorption and reflection, or insulation. In addition, per The Theory, there is another possible forcing in play, which is an added forcing for extra water vapor in the upper troposphere due to increased CO2 presence and warming.

    Solar output is not a comparison so much as it is a Factor in the equation along with the CO2 as a Factor. Water Vapor is a Factor. Methane is, along with a diminishing number of other factors, and occasionally and randomly, a volcano.

    The argument is if the extra forcing from water is present, which changes the possible forcing from 1.1wm^2 of extra input at 550ppm to 3.58 to 4.4wm^2 of input at 550ppm.

    The models as ran use hold solar input at a constant. They also ran to show about 4.4wm^2 of forcing (before Otto et al (2X) and now the Santer/Mann paper).

    The Skeptics have said you need to have a variable solar input, and that, now in agreement with Santer/Mann, there is not the forcing that would result in 3.5-4.4wm^2 from water vapor, but only 1.1wm^2 for CO2 alone, at 550ppm.

    We are only at 400ppm though, up from 285ppm in 1850 or so, not 550ppm (and I just ran a basic linear equation instead of a logarithmic, I know. It is close enough to get a grasp on the size of the amounts that matter, and I rounded for simplicity, since the error margin is in the full single digit wm^2 range.) Hence, just using .25wm^2 for the current 2017 level of AGW change.

    It can be said, correctly, that they are not comparable, but it is obtuse in the manner that it also is a factor in the equation, and hence cannot be ignored. If there is a larger change in the solar input than the insulation change, then it is the larger factor. If we are looking at a change of up to 6wm^2 in the input, the solar input is significantly larger than CO2. If solar input is only 1wm^2, it still is the most significant factor, by a factor of 4.

    I have shown various papers that show solar input changes at 1 or 2 or 4 or 6 wm^2, a variation that overwhelms an insulating factor that right now accounts for .25wm^2 of insulated 'warming' - CO2 actually doesn't warm anything, just delays the energy release back out. Water vapor didn't respond in the forcing as predicted to add extra insulation.

    Since solar input to the earth is still the largest factor, and due to so many unknowns about how that affects us (including the CLOUD experiment) we are still premature in having any hard and fast numbers.

    Clear enough?
    Josh Coray
    J4 Paintball
    Lead Design
    www.j4paintball.com

  6. #226
    Insider PBSteve's Avatar
    Join Date
    May 2012
    Location
    Los Angeles
    Posts
    3,084
    Quote Originally Posted by pbjosh View Post
    This is a basic black body equation, with a modifier for the atmosphere. You have solar output to the object at a higher level radiation input, followed by absorption, and remittance at a lower bandwidth. This lower bandwidth is further complicated by the troposphere (the modifier) that will have added absorption and reflection, or insulation. In addition, per The Theory, there is another possible forcing in play, which is an added forcing for extra water vapor in the upper troposphere due to increased CO2 presence and warming.
    I am being no more obtuse than you are by omitting ALL of that in your little bit of "relativity".

    And I still don't think you have it figured out. The actual equations are important, as is the order of things. When does albedo become important? What portion of light is converted into thermal energy by the earth, and further, what portion of the earth's black body spectrum contributes to the greenhouse effect, and therefore atmospheric warming? What portion just passes into space?

    After all of those reductions, what does your 3-5 w/m^2 look like? What does the solar variation look like at the surface? I could save you some time and tell you once you put your 3-5 W/m^2 through all those filters, it's not big. By the way, if that variation is correct, it only amounts to a 0.2%-0.35% variation in solar output.

    Quote Originally Posted by pbjosh View Post
    The Skeptics have said you need to have a variable solar input, and that, now in agreement with Santer/Mann, there is not the forcing that would result in 3.5-4.4wm^2 from water vapor, but only 1.1wm^2 for CO2 alone, at 550ppm.
    Where does it say that? I genuinely can't find it. Here's what the paper I'm reading (and you're citing) says. Did you actually read it?

    'Perfect model' analysis
    It has been posited that the differences between modelled and observed tropospheric warming rates are solely attributable to a fundamental error in model sensitivity to anthropogenic greenhouse gas increases28. Several aspects of our results cast doubt on the 'sensitivity error' explanation. First, it is difficult to understand why significant differences between modelled and observed warming rates should be preferentially concentrated in the early twenty-first century (see Fig. 2). A fundamental model sensitivity error should be manifest more uniformly in time. Second, a large sensitivity error should appear not only in trend behaviour, but also in the response to major volcanic eruptions46. After removal of ENSO variability, however, there are no large systematic model errors in tropospheric cooling following the eruptions of El Chich?n in 1982 and Pinatubo in 199115.

    We performed a ?perfect model? analysis to further investigate this issue. We consider whether asymmetries in the sign and temporal distribution of significant trends in 1Tf −o(k, t) could be solely due to the combined effects of a large model sensitivity error and different realizations of modelled and observed internal variability. The ?perfect model? study emulates our analysis of the ?MMA minus satellite? difference series. Now, however, the difference series 1Tf −f (j, t) is formed between the MMA and each individual HIST+8.5 realization. We calculate ?perfect model? values of the γ1, γ2 and γ3 statistics not only over 1979 to 2016, but also over three earlier and two later 38-year analysis periods (see Methods).

    ....

    In contrast, statistically unusual values of all three asymmetry statistics could have been plausibly generated by the temporal coincidence of multiple externally forced and internally generated cooling influences in the early twenty-first century. Internally driven contributions to the ?warming slowdown? arise from the transition to a negative phase of the Interdecadal Pacific Oscillation (IPO) in roughly 199911,13,16,52, and from changes in the phasing of other internal variability modes14,53. Our statistical results are best explained by the combined effects of these known phase changes and by previously identified systematic model forcing errors in the early twenty-first century2,17,20,25,27
    Ever so many citizens of this republic think they ought to believe that the Universe is a monarchy, and therefore they are always at odds with the republic. -Alan Watts

    I work for the company building the Paragon

  7. #227
    Insider
    Join Date
    Apr 2012
    Location
    Knoxville, TN
    Posts
    2,303
    I am being no more obtuse than you are by omitting ALL of that in your little bit of "relativity".
    I wasn't omitting. I assumed you understood this very basic, "Climate Science 101 - Day One" understanding of the process, since you presented as if you were up on the subject, and I was the fool. Like I have mentioned, the problem lies in my filling in where I expect you to have some understanding on this topic I am well versed in. I take so much as a given with someone who claims that I am an idiot, that I don't understand it, yet they do not understand the first steps in. If you didn't understand this, then any criticism you had of my comments is mute. Maybe it was ignorance and arrogance instead of obtuseness, my mistake.

    And the reason I 'don't have it figured out', is because it ISN'T figured out. I have been saying that from day 1. The AGW Alarmists nor the Skeptics have it 100%. It is a very young science because we are still limited in the quality of data we collect, and a lot of the claims contradict each other. There is a large margin of error because of that. As a group, Climate Scientists are still figuring out things like the cloud models, how they interact. Water Vapor feedbacks. Aerosol affects. Actual amounts int he energy budget. Clouds alone cause huge differences in the wm^2 budget, and we don't track them in the models except as a percentage.

    I have cited a few dozen papers on here - and often they contradict. Using the Perfect Model analysis can work one way, but only if you hold variables constant. Hence, the problem with using the Cess Method like the IPCC is using.

    In fact, lets look at what you said here:

    Where does it say that? I genuinely can't find it.
    Again, this is early climate science and models. More like Climate Science 101, Week 1 or 2. If you don't have this basis, then you are far behind in the basics. You should know this Steve. It should be fairly easy to find. It's basic. The foundation of The Theory.

    If you want a look at the maths, here is a link, with commentary on the problems with the Cess Method, and general flaws. There are references at the link that cover the basic equations used, if you want to review them. http://notrickszone.com/2016/10/02/l....yIt9Fbog.dpbs

    Here, lets just copy the whole thing, since it cover albedo and a few other topics (bold is mine, to show the areas that cover wm^2 numbers, caps are from Dr Cess):

    Soden & Held [1] shows climate sensitivity is 3°K for 2xCO2 from the 14 GCM studies for the IPCC 4th Assessment Report (2007) as follows:

    Climate sensitivity = no-feedback sensitivity (Planck response) x feedbacks

    = 1.2°K x 2.5 = 3°K

    Here, feedbacks are water vapor, ice albedo, lapse rate and cloud feedback.

    In the AGW theory of the IPCC, the central assumption is that the Planck response is 1.2°K. Cess [2, 3] obtained the Planck feedback parameter lambda0 of -3.3(W/m2)/K utilizing eqn (1), giving the Planck response of 1.2K with the radiative forcing RF of 4W/m2 for 2xCO2 as follows:


    Coincidently, the Planck response of 1.2°K by eqn (3) is in very good agreement with the Planck response of 1.2 – 1.3°K obtained with one dimensional radiative convective equilibrium model (1DRCM) studies in the literature [4, 5, 6]. Therefore, the Cess method has been followed by many researchers, including the IPCC 1stAssessment Report (1990) and the 14 GCM studies for the IPCC 4th Assessment Report (2007).
    It is the sole theoretical basis of the central assumption of the IPCC that the Planck response is 1.2°K at present time [7, 8, 9], because the 1 DRCM study is fudged due to its strong dependence on lapse rate used according to Hansen’s idea expressed in an interview with Spencer Weart held on 23 October, 2000 at NASA.


    On 23 August, 2016, Dr. Robert D. Cess gave me the following answer to my mail, admitting his mathematical errors in the derivation from eqn (1) to eqn (3). Dr. Cess was the leading climate scientist of Intercomparison Project of GCMs for the IPCC Assessment Reports. He wrote:

    I will try this one more time, and then I will give up. A lot has happened since M&S (1964) and M&W (1967). In modern usage, the no-feedback sensitivity refers to holding all climate parameters fixed except surface temperature. It addresses the question: What would the sensitivity be if there were no interactive climate feedback mechanisms?. Simply stated, it is a hypothetical reference sensitivity. NO ONE HAS EVER CLAIMED THAT THE NO-FEEDBACK SENSITIVITY IS A TRUE INDICATION OF THE REAL SENSITIVITY.“
    The AGW theory of the IPCC is constructed on the Planck response of 1.2°K produced by the mathematically erroneous Cess method. Since Cess has admitted his mathematical errors in the above reply, the theory totally collapses together with the high climate sensitivity of 3°K for a doubling of CO2. It raises sea surface temperature as much as 2°K, thus leading to the various AGW scares such as rapid sea level rise and severer extreme weather in the GCM studies of the IPCC.
    Kimoto [11] showed the surface climate sensitivity of 0.14-0.17°K with the surface radiative forcing of 1.1 W/m2 for 2xCO2. It is reduced from the radiative forcing of 3.7 W/m2 at the tropopause due to infrared absorption overlap between CO2 and water vapor plentifully existing at the surface.


    Mind you, references are in the link, for further confirmation. While this link doesn't cover all of the subject, it covers a good portion of it in one nice compact typeout. I can find walls of related info, but you have stated you don't seem to like that.
    Last edited by pbjosh; 11-28-2017 at 09:37 AM.
    Josh Coray
    J4 Paintball
    Lead Design
    www.j4paintball.com

  8. #228
    Insider
    Join Date
    Apr 2012
    Location
    Knoxville, TN
    Posts
    2,303
    Lets look at this then:
    After all of those reductions, what does your 3-5 w/m^2 look like? What does the solar variation look like at the surface? I could save you some time and tell you once you put your 3-5 W/m^2 through all those filters, it's not big. By the way, if that variation is correct, it only amounts to a 0.2%-0.35% variation in solar output.
    And, yeah, you are right. It is a small, small affect. I agree. BUT:

    It is still greater than .25wm^2 - by a large margin. What does that make the total for CO2 input? 0.02%? Even at a full doubling, even if it is all us, it is tiny.

    And we are talking about all warming from something like 3K with no sun (back ground cosmic radiation), to 288K, so a small percentage would be felt. Up and down. Without the cloud effects and related findings from the CERN CLOUD and SKY experiments, which can affect a 100wm^2 swing of reflected to retained heat.

    As I showed almost a dozen times, we have proxy data that consistently shows Solar Output affecting climate, before any human affect. Climate and solar output tracks through a multitude of proxies, for not only a few thousand years, but even back though glacial records over millions of years. This warming period, an Inter glacial, happens every 110,000 years or so, lasts for 11-12,000 years, and we are 10,000 years in. The last interglacial was warmer than this one. Same with the one before that.

    That is almost all solar. CO2 is significant (the $10 out of $100 rule), and it tracks warming (follows instead of leads) through the last set of interglacials. But it isn't a driver. It is a result, generally, of warming.


    Also, watch dust. See where the average drops below 200ppm for CO2? That is when plants start to die off in large numbers - and see the dust level rise with that? The dust rises, and when the sun goes through a 23,000 year Milankovitch cycle, and there is extra dust that reduces the reflection of the ice, and we warm back up. If it wasn't for that dust feedback, the earth would have been covered with ice, and life would die out.


    Lets see if this link works for you to download from. I can send you the PDF if not:

    https://ac.els-cdn.com/S167498711630...829e9beac0a1fc

    Since the discovery of ice-age cycles almost two centuries ago, a
    large amount of geological evidence has been assembled from a
    variety of sources, and many different hypotheses have been
    advanced to account for their approximate 100 kyr periodicity and
    asymmetric, saw-tooth temperature response. Improved calculations
    of Milankovitch insolation cycles and greater precision of
    Antarctic ice-core records demonstrate that each major deglaciation
    coincides with maximum summer insolation in the northern
    hemisphere. And yet many of the other insolation maxima only
    trigger minor warming events, and so interglacials only occur after
    four or five insolation cycles. No generally accepted explanation
    exists for this peculiar intermittent climate response, and any
    comprehensive explanation for ice-age modulation and periodicity
    has to be able to explain this anomaly.

    The answer to this conundrum can be found in a novel reanalysis
    of the effects of decreasing atmospheric CO2 concentrations
    during an ice-age. Ice age CO2 reductions coincide with an increase
    in ice sheet extent and therefore an increase in global albedo, and
    this should result in further cooling of the climate. But what actually
    happens is that when CO2 reaches a minimum and albedo
    reaches a maximum, the world rapidly warms into an interglacial. A
    similar effect can be seen at the peak of an interglacial, where high
    CO2 and low albedo results in cooling. This counterintuitive
    response of the climate system also remains unexplained, and so a
    hitherto unaccounted for agent must exist that is strong enough to
    counter and reverse the classical feedback mechanisms.

    The answer to both of these conundrums lies in glacial dust,
    which was deposited upon the ice sheets towards the end of each
    glacial maximum. Previous research has considered two effects of
    this aeolian dust on the glacial climate: the increased albedo of
    atmospheric dust cooling the climate, and the mineral fertilization
    of marine life reducing atmospheric CO2. But both of these effects
    would result in a cooling feedback, and therefore provide no explanation for the interglacial warming that appears to result from
    dust deposition. In great contrast to these explanations it is proposed
    here that during the glacial maximum, CO2 depletion starves
    terrestrial plant life of a vital nutrient and causes a die-back of
    upland forests and savannahs, resulting in widespread desertifi-
    cation and soil erosion. The resulting dust storms deposit large
    amounts of dust upon the ice sheets and thereby reduce their albedo,
    allowing a much greater absorption of insolation. Up to
    180 W/m2 of increased absorption can be provided to the northern
    ice sheets, when calculated seasonally and regionally instead of
    annually and globally.
    This dramatic increase in insolation and absorption results in
    melting and dissipation of the northern ice sheets, and the establishment
    of a short interglacial period. Ice ages are therefore forced
    by orbital cycles and Milankovitch insolation, but regulated by icealbedo
    and dust-albedo feedbacks. And the warming effects of
    dust-ice albedo are counterintuitively caused by a reduction in
    global temperatures and a corresponding reduction in CO2 concentrations.
    And while this proposal represents a reversal of conventional
    thinking it does explain each and every facet of the glacial
    cycle, and all of the many underlying mechanisms that control its
    periodicity and temperature excursions and limitations.
    Last edited by pbjosh; 11-28-2017 at 11:49 AM.
    Josh Coray
    J4 Paintball
    Lead Design
    www.j4paintball.com

  9. #229
    Insider
    Join Date
    Apr 2012
    Location
    Knoxville, TN
    Posts
    2,303
    Small addition, from the dust link, a Table::

    Table 3
    Difference in insolation and absorption for dusty ice vs. clean ice (based upon
    Table 2).
    Great Winter (annual midsummer)
    Ice sheet insolation (less cloud & haze) 360 W/m2
    Fresh ice absorption at 0.90 albedo 36 W/m2
    Dusty ice absorption at 0.85 albedo 54 W/m2
    Increased absorption due 20 ppm dust 18 W/m2

    Great Summer (annual midsummer)
    Ice sheet insolation (less cloud & haze) 430 W/m2
    Fresh ice absorption at 0.90 albedo 43 W/m2
    Dusty ice absorption at 0.85 albedo 65 W/m2
    Increased absorption due 20 ppm dust 30 W/m2
    Dusty ice absorption due 200 ppm dust 170 W/m2 (0.60 albedo)
    Increased absorption due 200 ppm dust 135 W/m2
    Dusty ice absorption due 400 ppm dust 215 W/m2 (0.50 albedo)
    Increased absorption due 400 ppm dust 180 W/m2

    55N ice sheet dust assumed as NGrip 8 ppm 3 ¼ 24 ppm.
    25 ppm dust ¼ 0.5 ppm soot equivalent, 200 ppm dust ¼ 4.0 ppm soot equivalent.
    From Svensson, soot and albedos are: 0.5 ppm ¼ 0.85, 4.0 ppm ¼ 0.60,
    8.0 ppm ¼ 0.50.
    Just 10 year-layers of ice ablation required to increase from 25 ppm to 200 ppm of
    dust.
    Notice the change from Great Winter to Great Summer is several, up to hundreds, of wm^2 in difference because of the change in solar output.
    Josh Coray
    J4 Paintball
    Lead Design
    www.j4paintball.com

  10. #230
    Insider PBSteve's Avatar
    Join Date
    May 2012
    Location
    Los Angeles
    Posts
    3,084
    Quote Originally Posted by pbjosh View Post
    Lets look at this then:


    And, yeah, you are right. It is a small, small affect. I agree. BUT:

    It is still greater than .25wm^2 - by a large margin. What does that make the total for CO2 input? 0.02%? Even at a full doubling, even if it is all us, it is tiny.
    This is nice, especially after that jib about Climate Science 101 day one. I assume you still haven't read Santer et. al. And once again, you're comparing solar output to radiative forcing, buuut I suppose you'll insist you're not. Again.

    Putting any and all discussion of climate change aside, you don't understand the basic physics of our climate system. Understanding substituted with walls of copied and pasted text, off topic enough to try and avoid detailed discussion of any specific point, are just not worth my time.

    It's too bad, because I thought at the beginning there might be a worthwhile discussion here.

    Good luck with all that.
    Last edited by PBSteve; 11-28-2017 at 09:22 PM.
    Ever so many citizens of this republic think they ought to believe that the Universe is a monarchy, and therefore they are always at odds with the republic. -Alan Watts

    I work for the company building the Paragon

Posting Permissions

  • You may not post new threads
  • You may not post replies
  • You may not post attachments
  • You may not edit your posts
  •